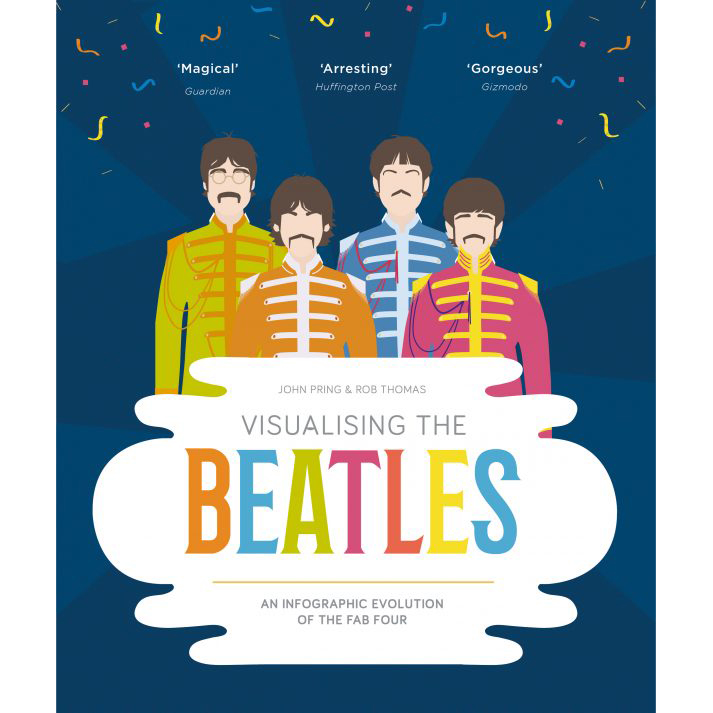
Visualising the Beatles
An Infographic Evolution of the Fab Four
Calling all Beatles fans – discover the story of the Fab Four through the stunning world of infographics.
“In all my years of supporting, advising and encouraging musicians and bands, I have referenced The Beatles a million times. Quite simply because they set the rules for rock and pop music”
– Damian Keyes (foreword).
If you binged Peter Jackson’s documentary ‘Get Back’, or if you loved Paul McCartney’s ‘The Lyrics’, look no further! Visualising the Beatles is the perfect data deep-dive in gorgeous graphics.
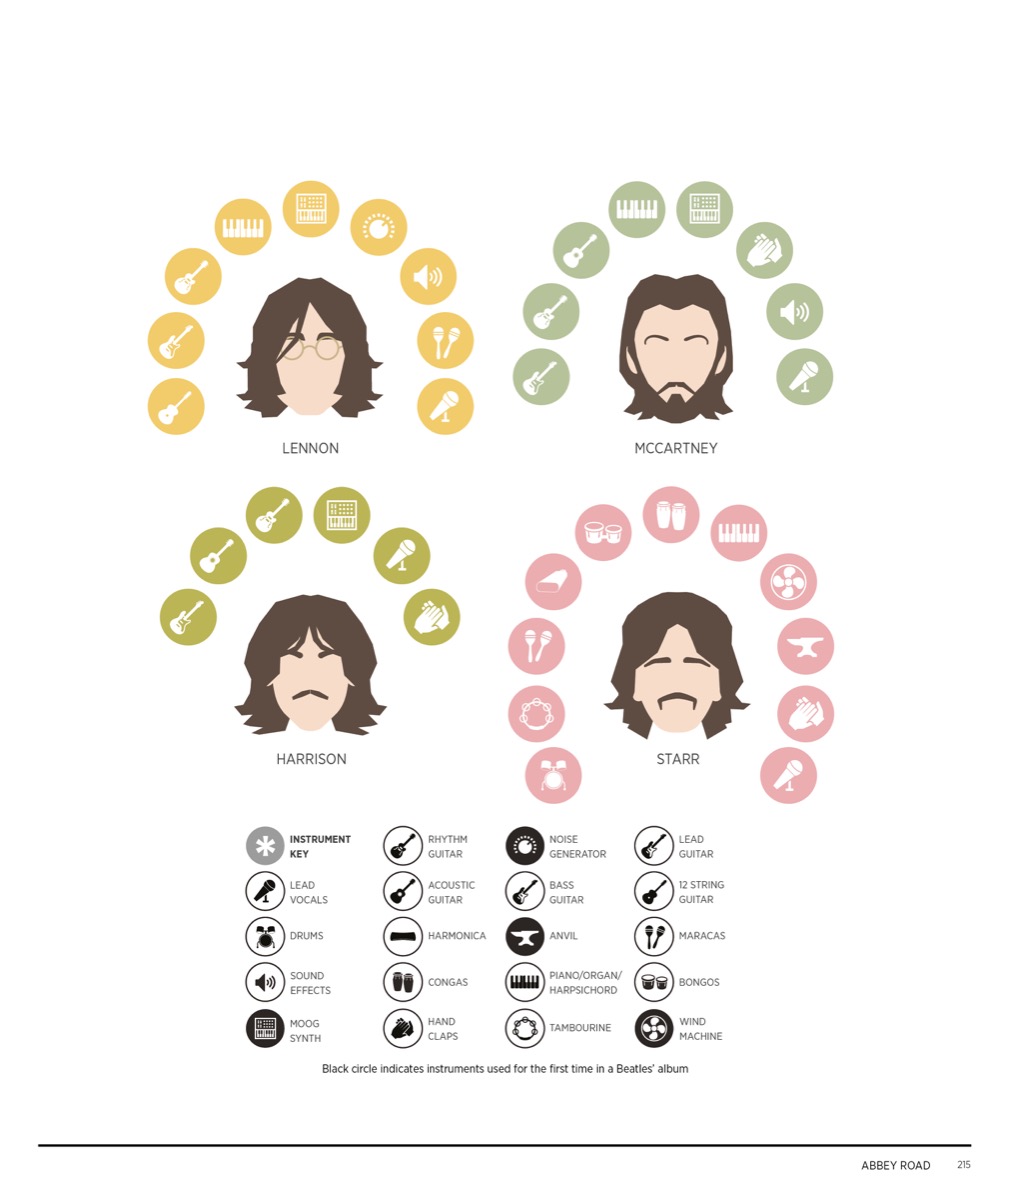
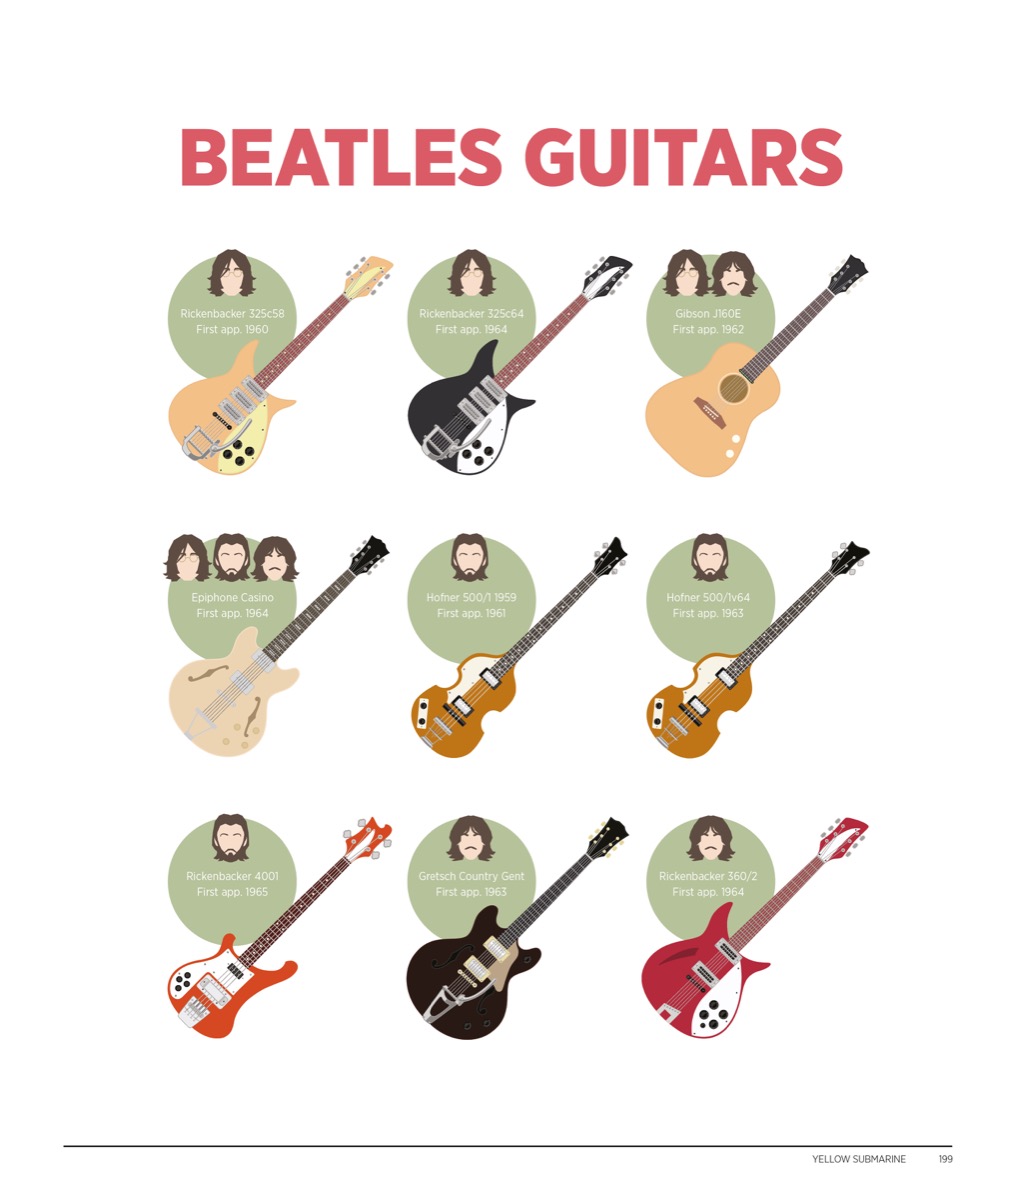
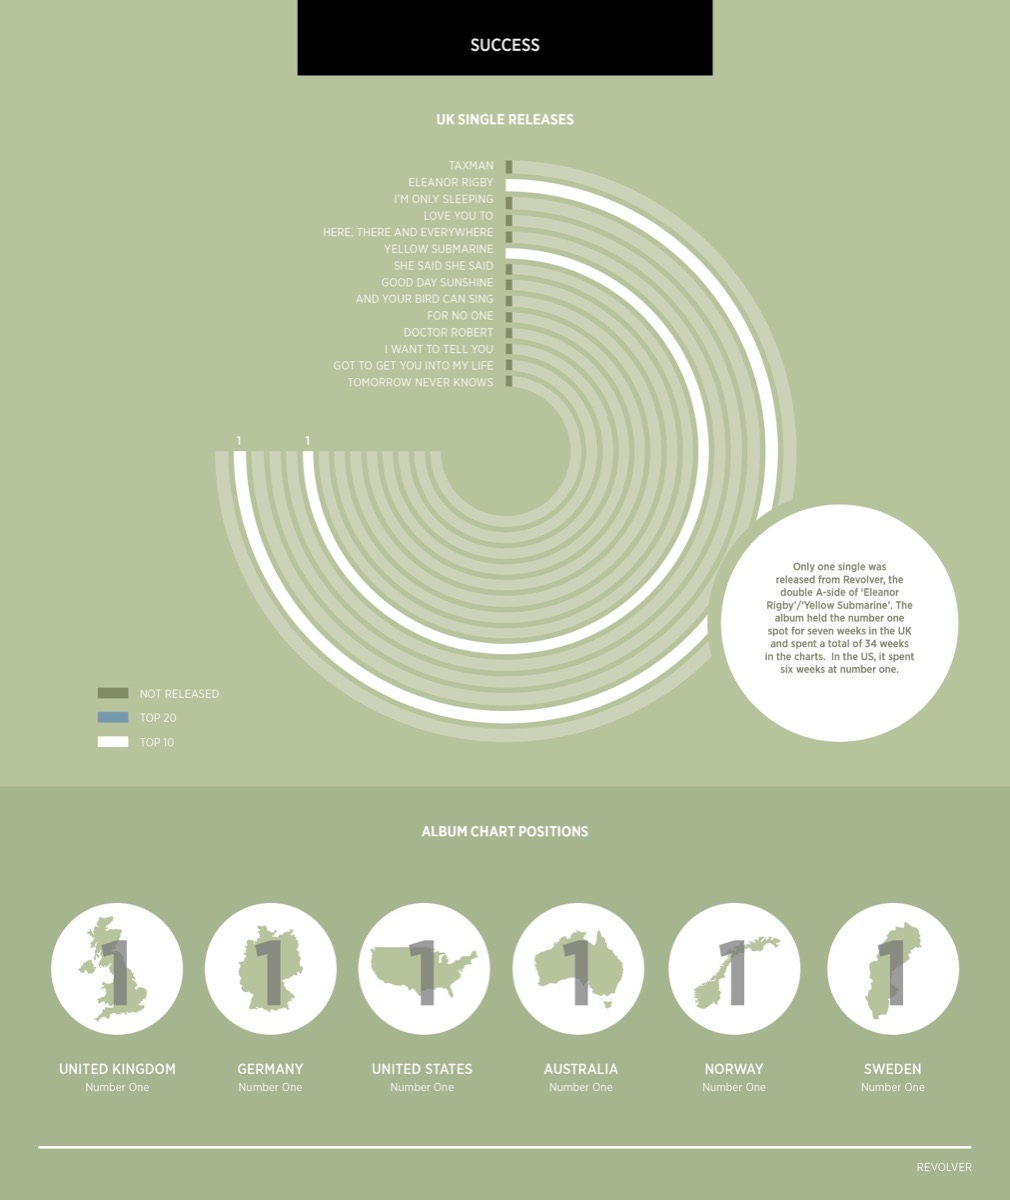
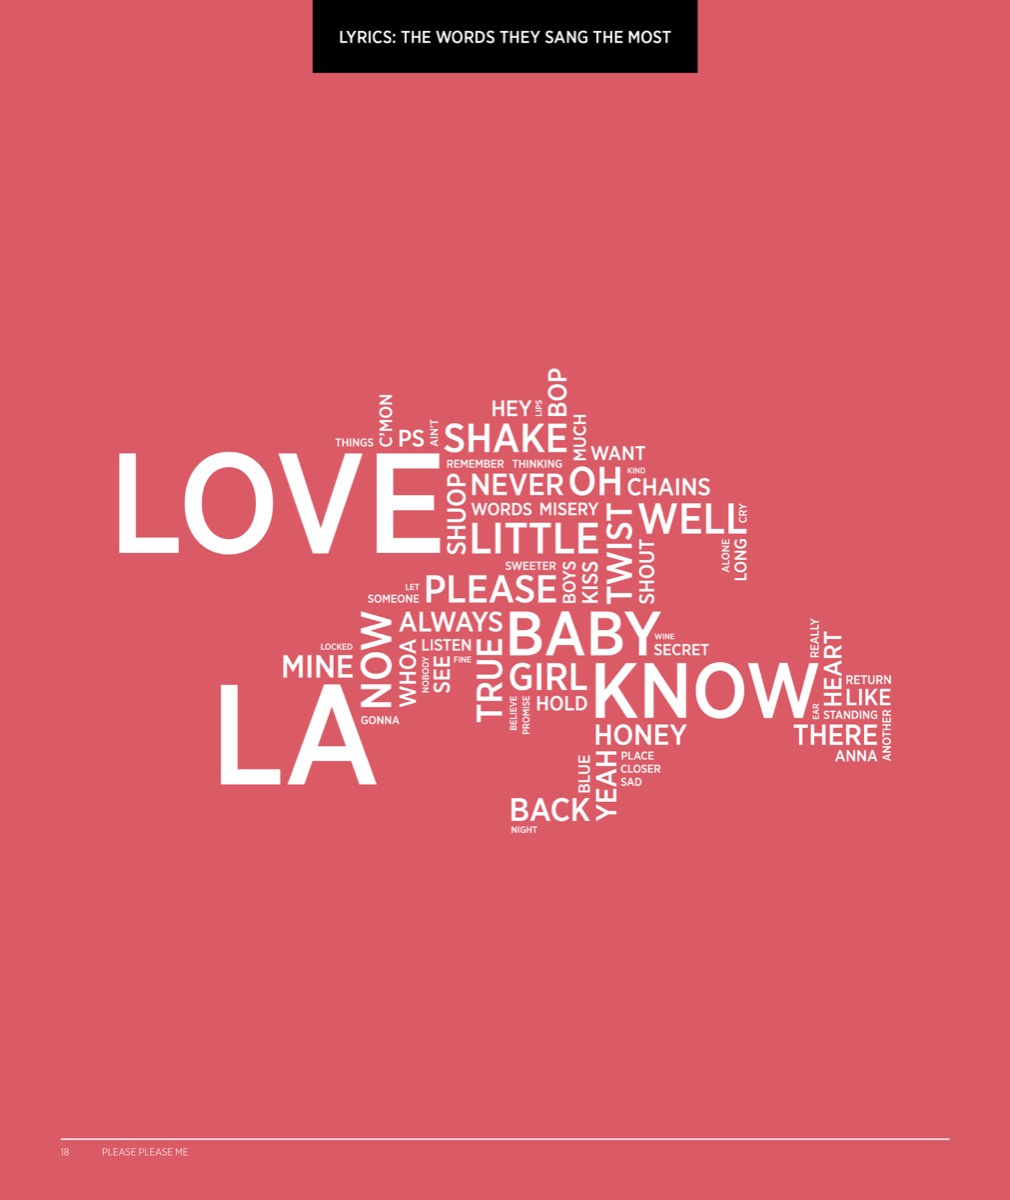
Visualising the Beatles is a ‘magical mystery tour’ of the electrifying days of Beatlemania. Travel through the vibrant sixties, from band’s first performance at the Cavern Club to their final 1969 rooftop concert. Experience an infographic delight, beginning with the band’s explosion into post-war Liverpool’s buzzing music scene. From their first album ‘Please Please Me’, the book explores every album ever made, right to their final release ‘Let it Be’.
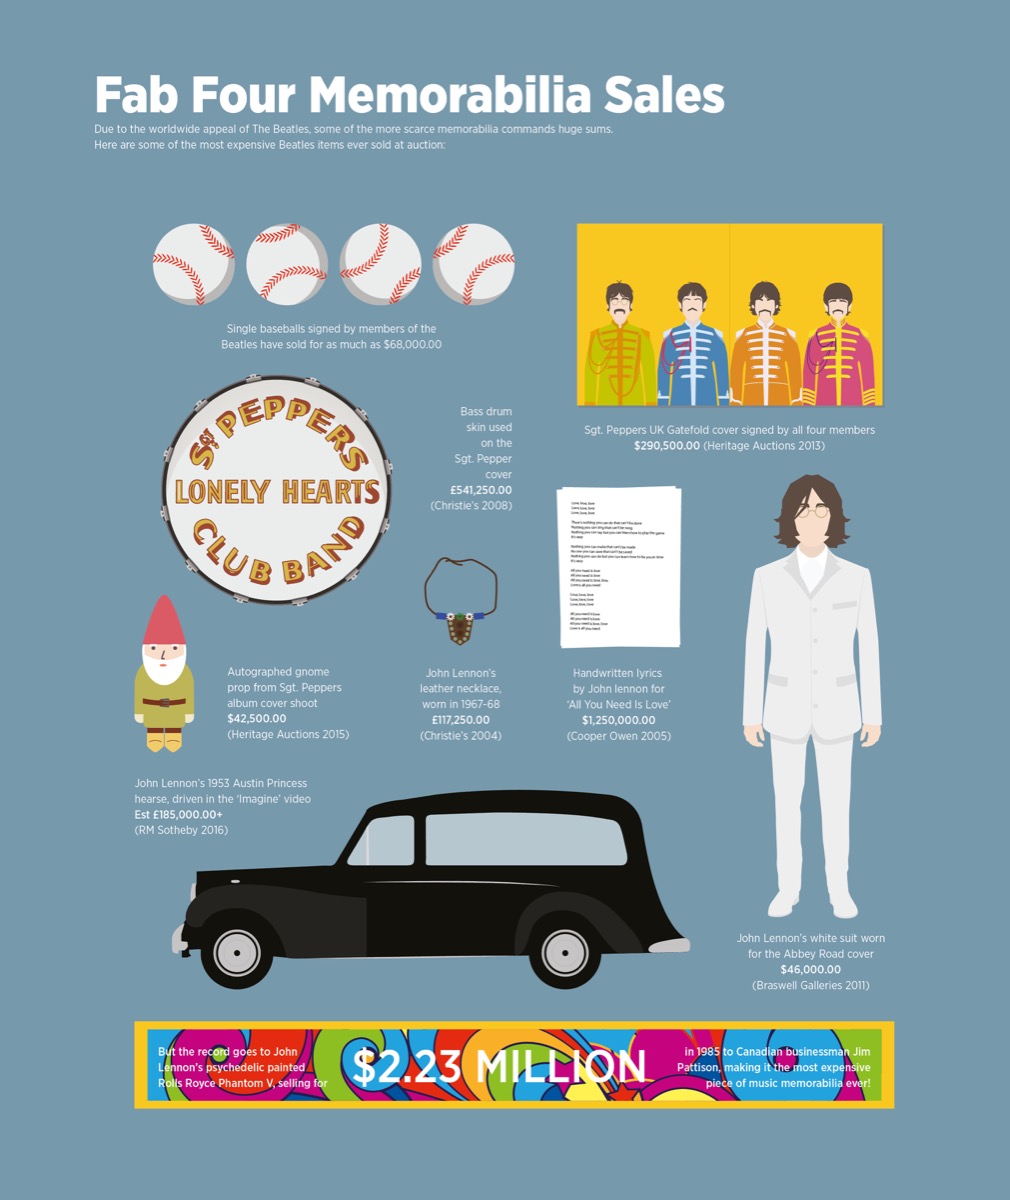
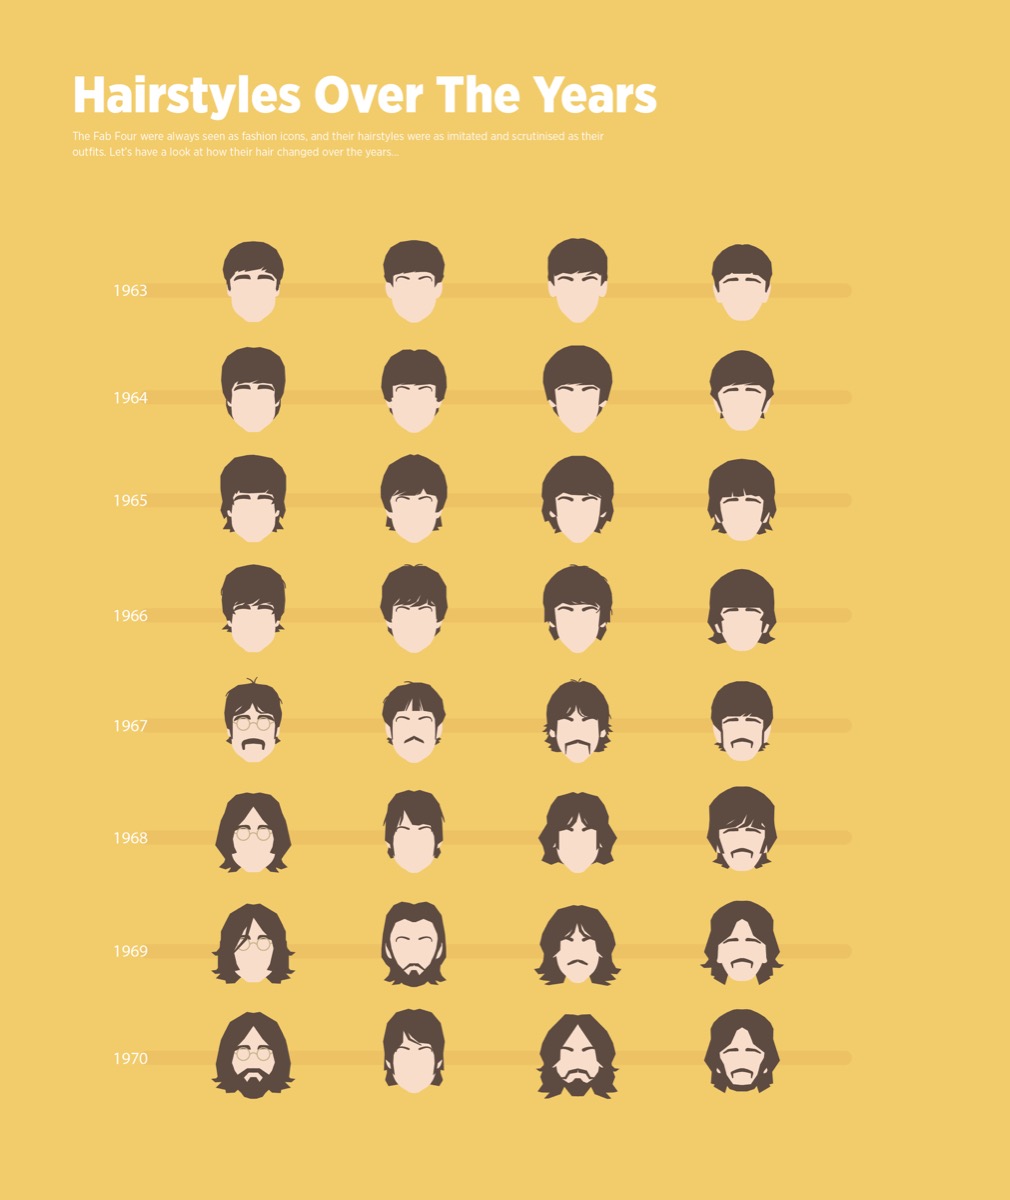
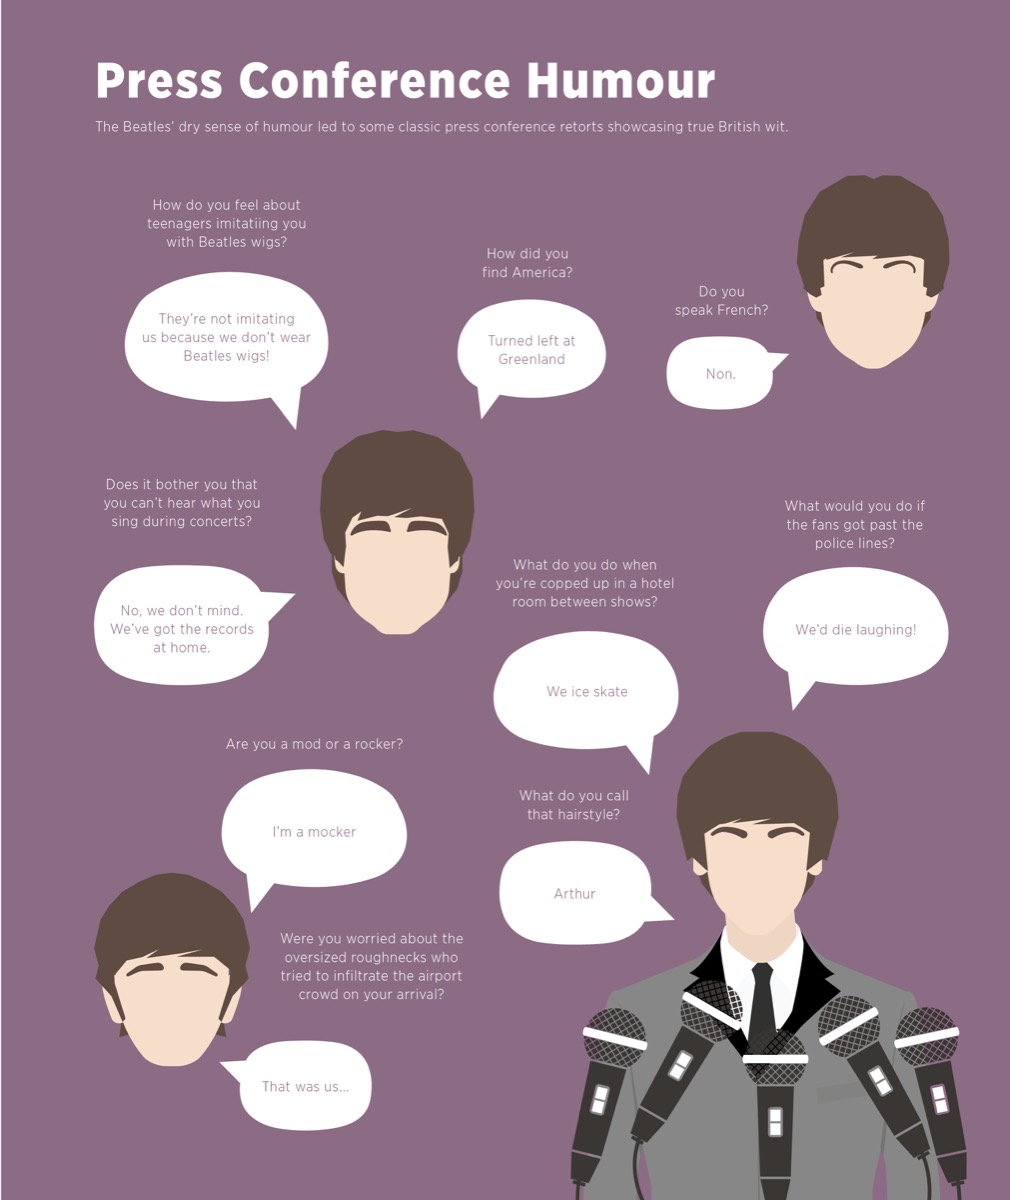
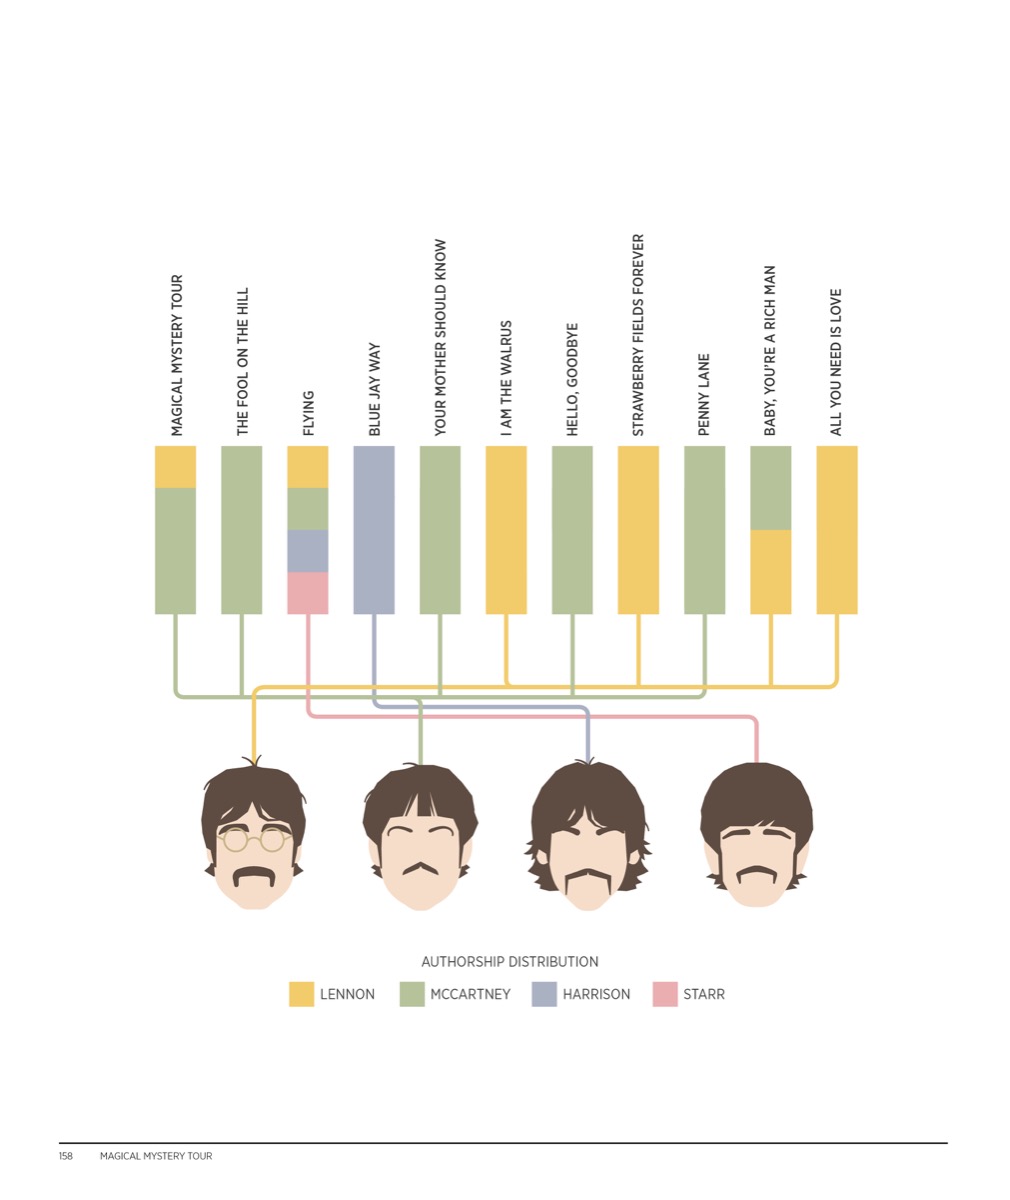
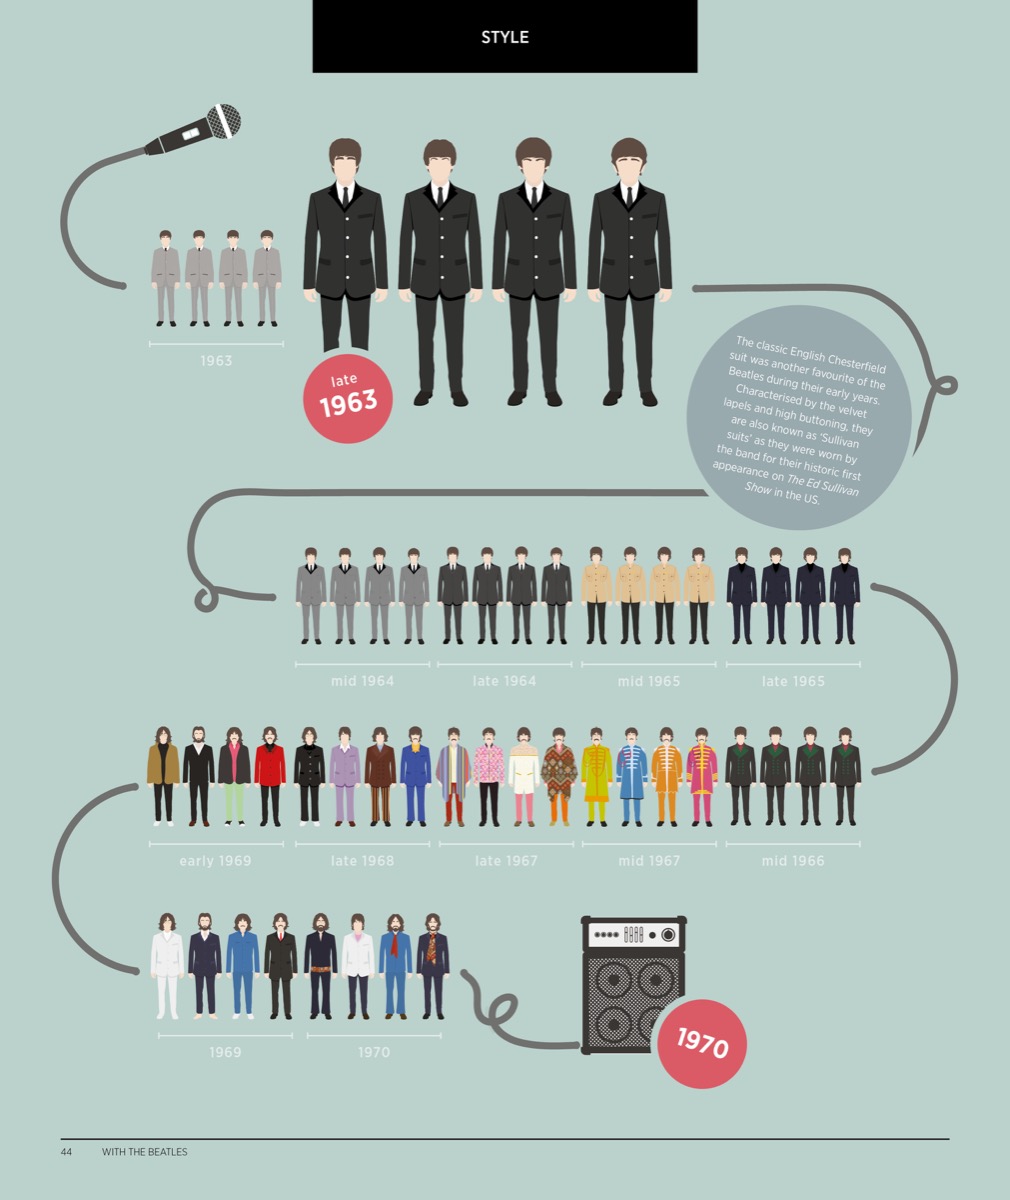
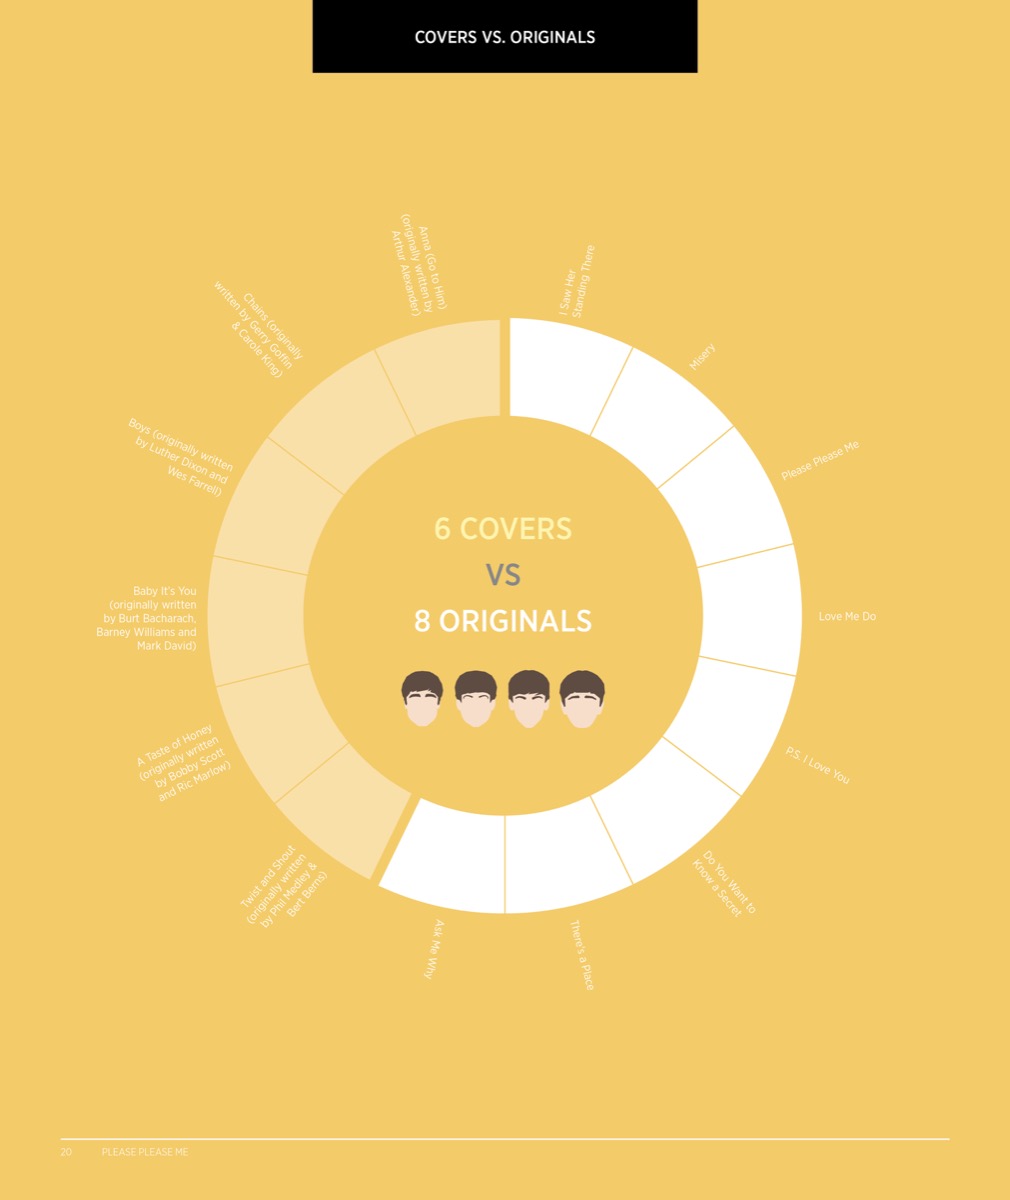
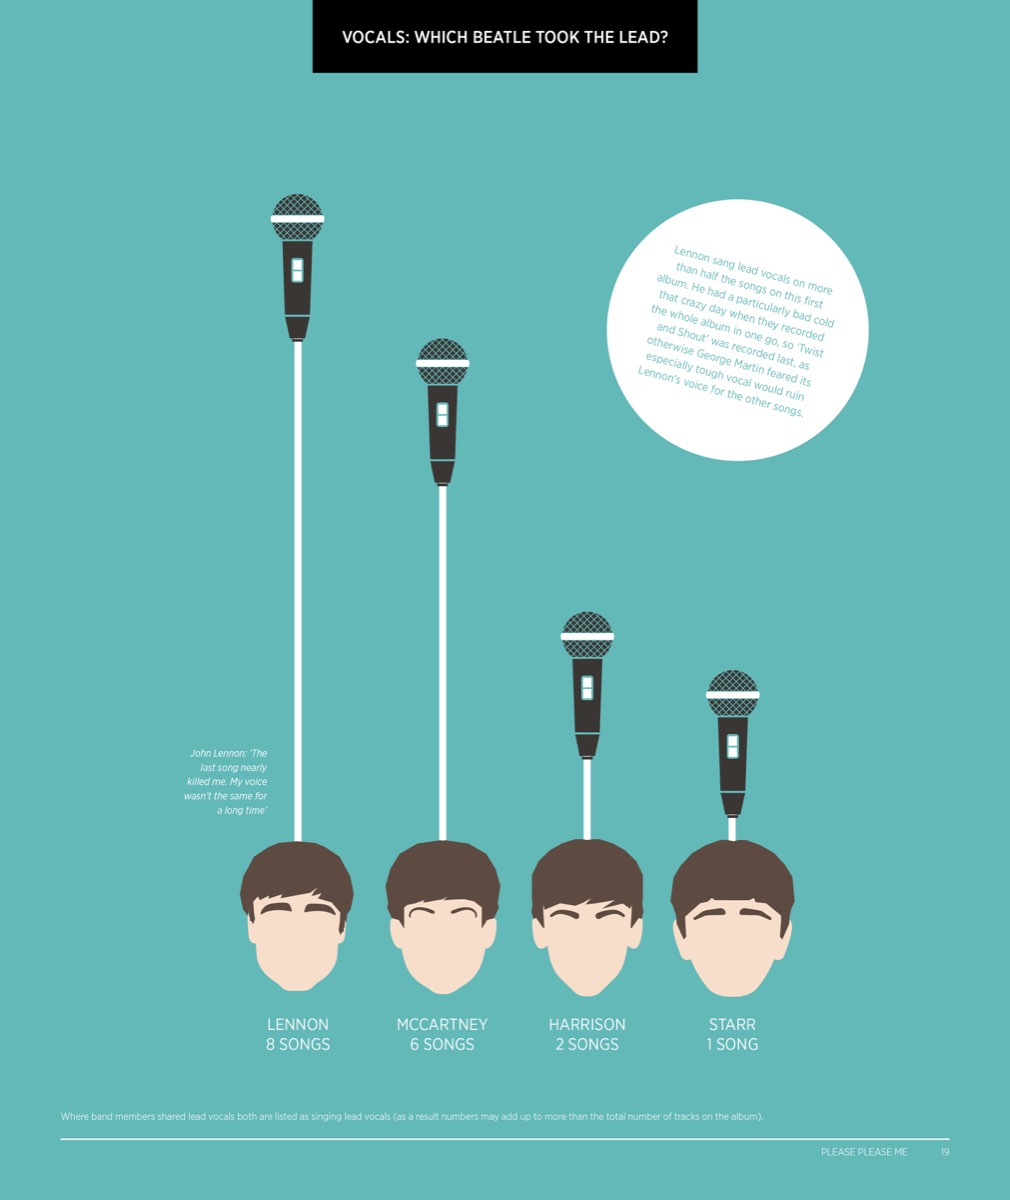
Appealing to both music lovers and graphic design enthusiasts alike, this book explores the Beatles’ musical genius like never before. Gain insight into everything from the lyrics and songwriting splits to their iconic album cover art. The book also features illustrations of their most recognisable outfit choices, including those worn on the cover of ‘Abbey Road’. Visualising the Beatles portrays the Fab Four through an entirely different lens. The visuals are both beautifully designed and easy to compare.
Dust off your vinyls or shuffle your Spotify playlist! Enjoy this fresh and fun look into the world of the swinging sixties…
For an interactive preview, follow this link!
Praise for Visualising The Beatles
“A magical history tour”
– The Guardian
“Amazing… the detail in this book is staggering – beautifully illustrated and covering every album The Beatles ever made in a truly original way. This is a book that every true Beatles fan will want to own”
– Bev Bevan, drummer of Black Sabbath and ELO
“Arresting… ‘see’ John, Paul, George and Ringo in vastly new and revealing ways”
– Kenneth Womack
“Entertaining, informative and beautifully presented… contains detailed research that will surprise even long time fans”
– John Stewart, Sleeper guitarist and Total Guitar columnist
“The evolution of the Fab Four has never before been documented in such a concise, exciting and beautiful way”
– Damian Keyes
“Gorgeous infographics… a fun, well laid out look at the data behind some of the catchiest and most influential songs ever written”
– Gizmodo
“What happens when data nerds consume a music album”
– Kickstarter
“For Beatles superfans and data geeks, this book is a dream”
– Column Five
“The Beatles catalogue is so vast and influential, only a data-led approach like this can help us truly make sense of it. Love *is* all you need, but visualisation can help too”
– Simon Rogers, author of Facts are Sacred
 About the authors
John Pring and Rob Thomas’ design agency Design By Soap creates renowned infographics. The list of of organisations is as diverse as Google, the Guardian, the Hard Rock Cafe and Saatchi & Saatchi.
Self-confessed Beatles geeks, the pair began to visualise the Beatles’ music and their story through infographics. When they launched a Kickstarter campaign to raise funds for printing they were overwhelmed by the response. Hundreds of people pledged their support and the project featured across the world, from the Washington Post to Gizmodo. Before they knew it, their project transformed into a beautiful book…
